- Hits: 2694
Penicillin Production and Quantification May2023
Strain collection
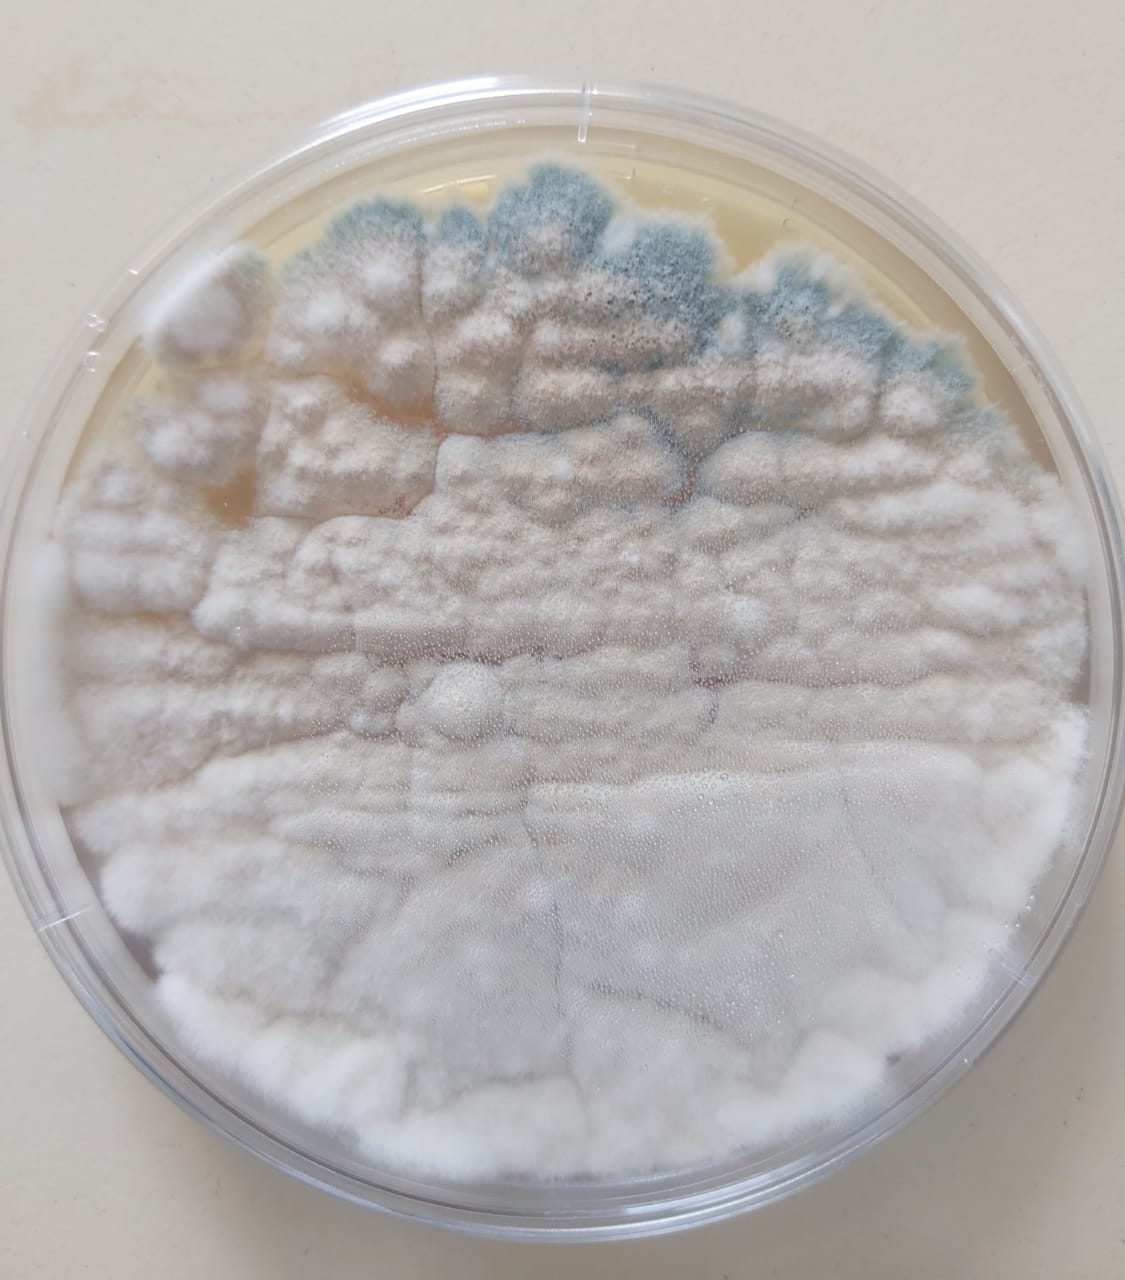
A strain of Penicillium chrysogenum has been preserved at the Doctoral School at the Lebanese University in Tripoli.
Preparation of the liquid medium (Broth):
0.5g peptone, 0.1g tryptone, 0.1g glucose, 0.1g yeast extract, 0.25g NaCl, 50ml distilled water were mixed and heated in a beaker. The pH was measured and adjusted to 7 by adding a few ml of H2SO4.
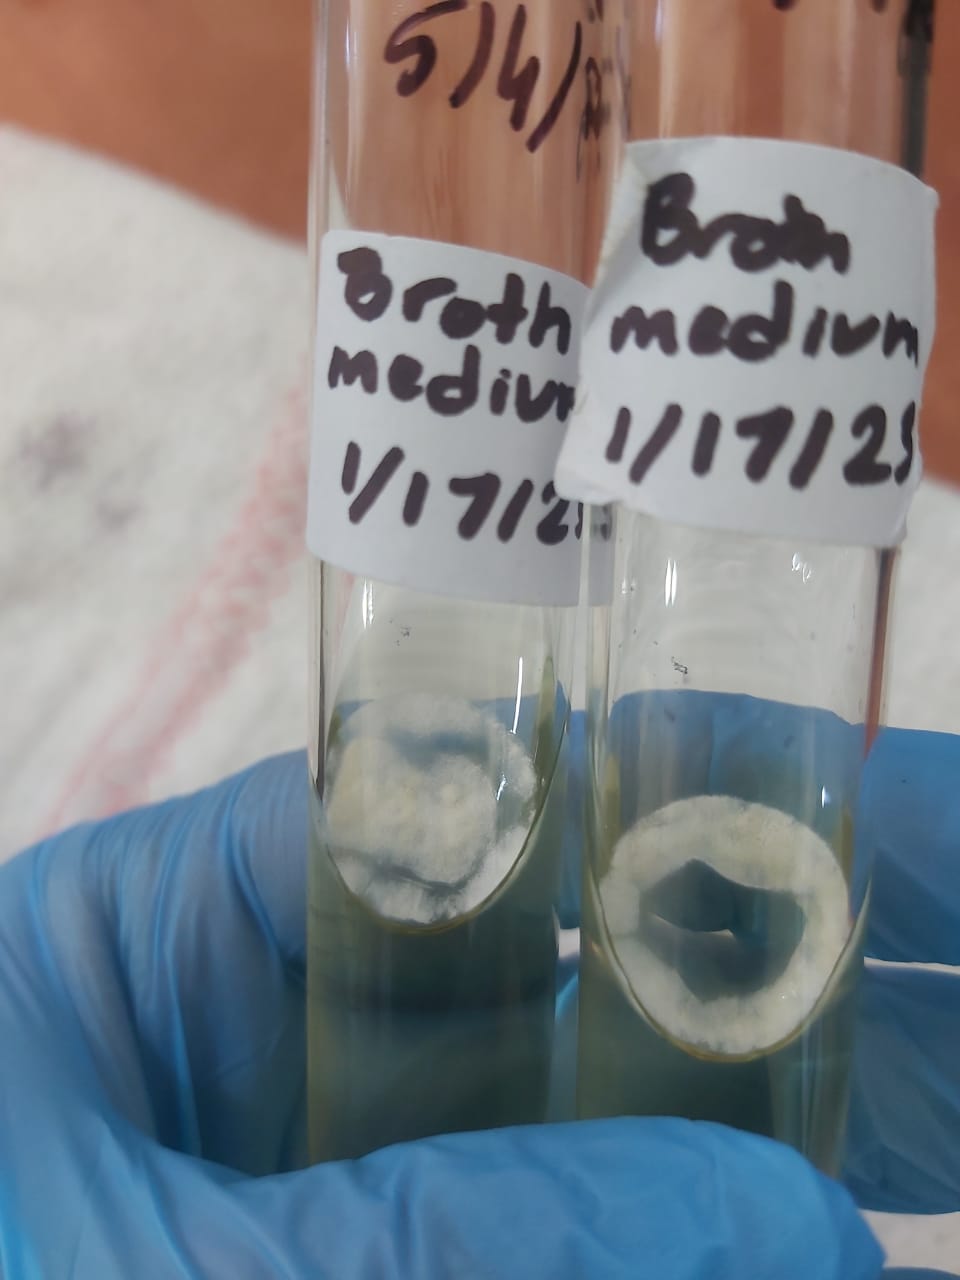
The medium was then placed in tubes, autoclaved for 1h and then cooled.
An inoculum is taken from the strain Penicillium chrysogenum using a sterile loop and then transferred and mixed in the liquid medium. The tube is incubated at room temperature for 4 days.
Constitutes of penicillin G fermentation broth:
|
Media |
Percentage% |
|
Peptone |
4% |
|
Lactose |
3-4% |
|
Glucose |
10% |
|
PAA(Crude Phenylacetic acid) |
0.5% |
|
Yeast extract |
4% |
|
CaCO3 |
1% |
|
Antifoam(corn oil) |
0.25-0.5% |
|
KH2PO4 |
0.4% |
- Prepare the nutrient media in 100ml distilled water.
- Measure the PH and then adjust it to 7 by adding a few ml of H2SO4
- Heat and mix for about 15min
- Autoclave the medium for 1h then cool it down for 30min
- Add the inoculum to the medium
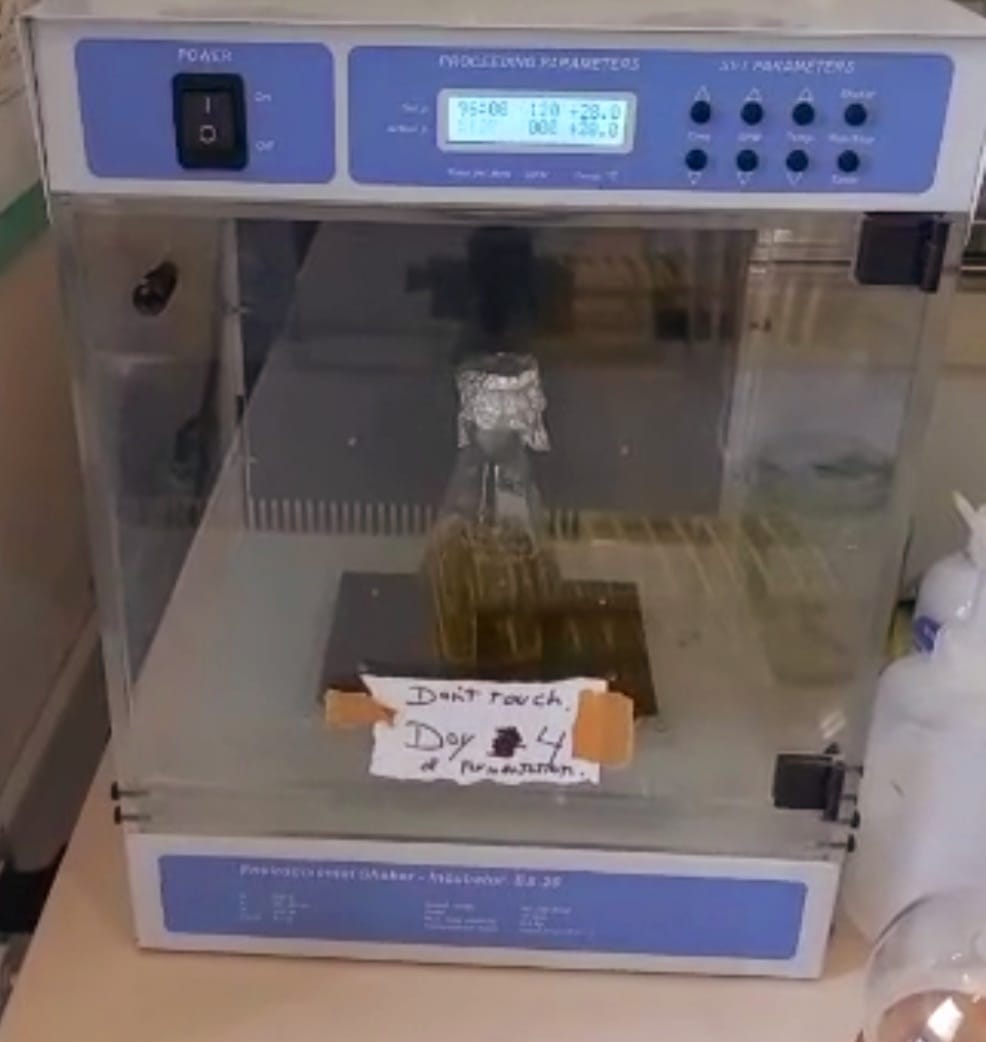
- Incubate the mix at 28˚C for 10 days with shaking (120 RPM)
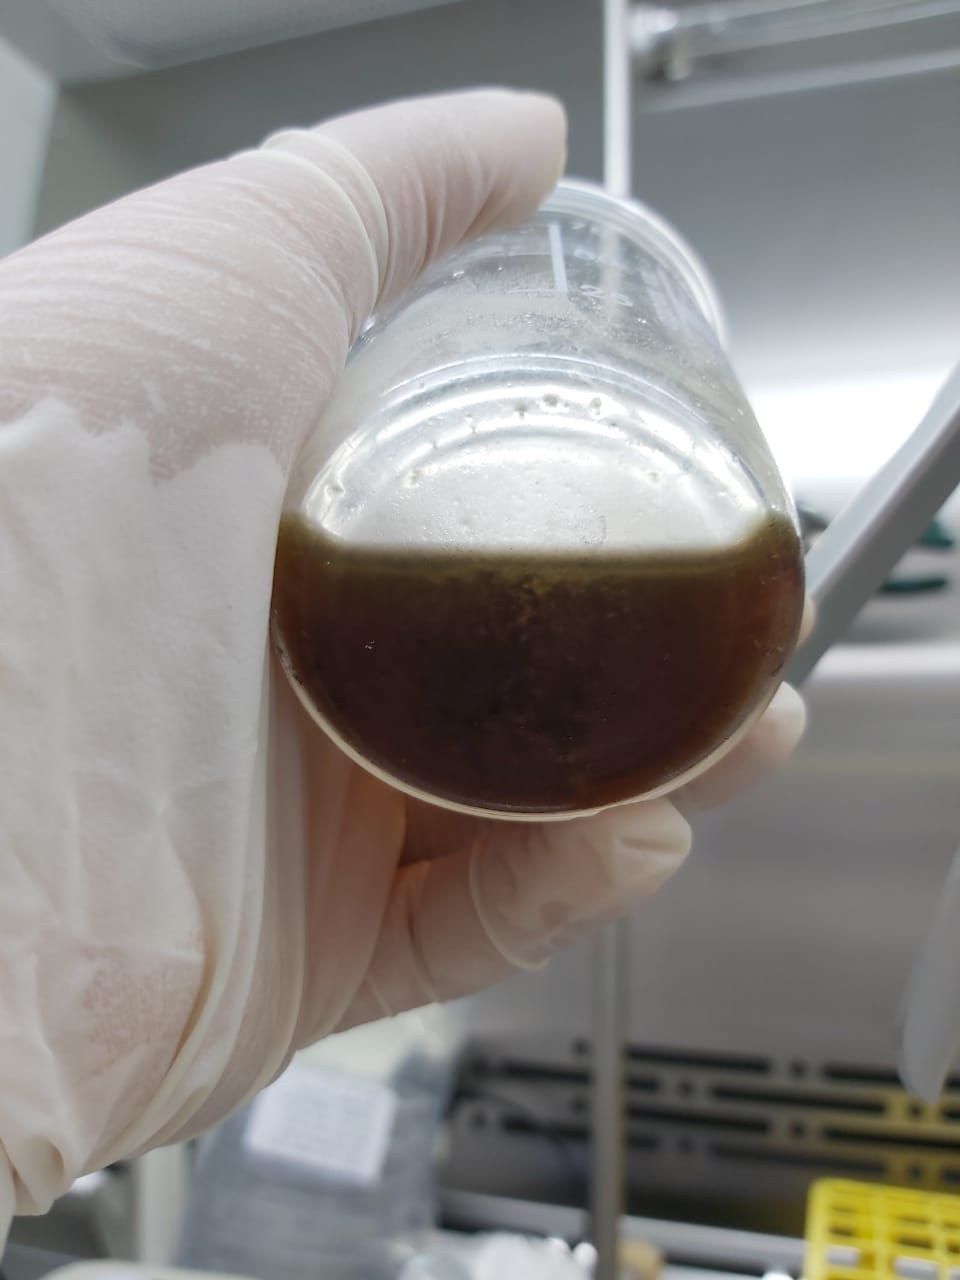
Filtration and purification:
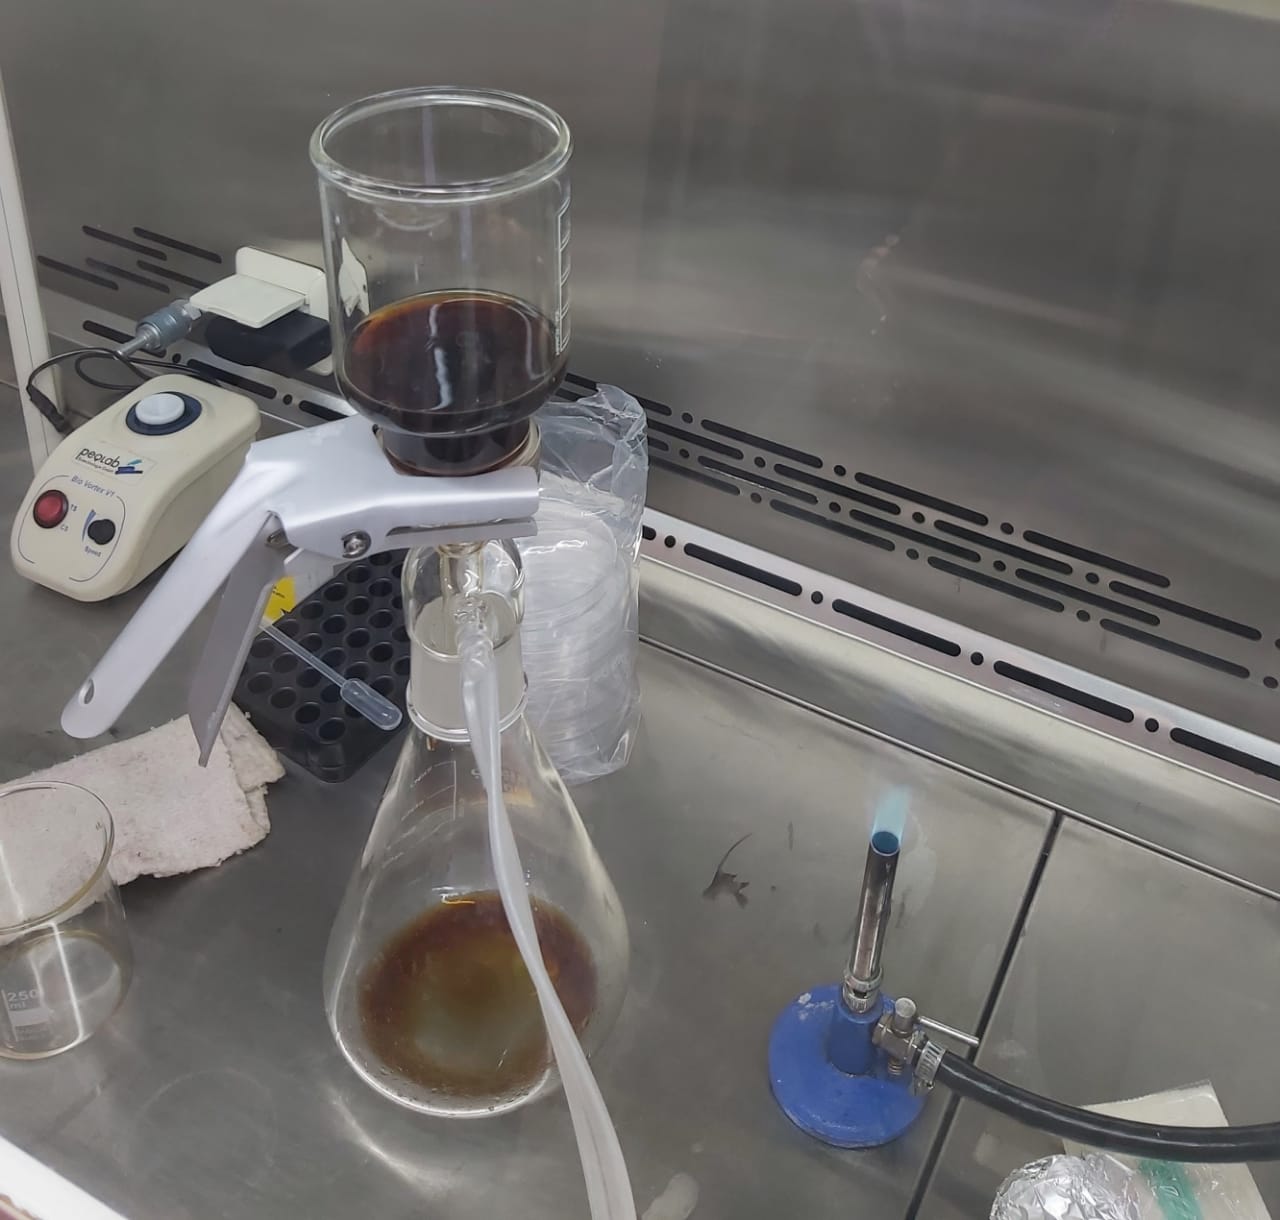
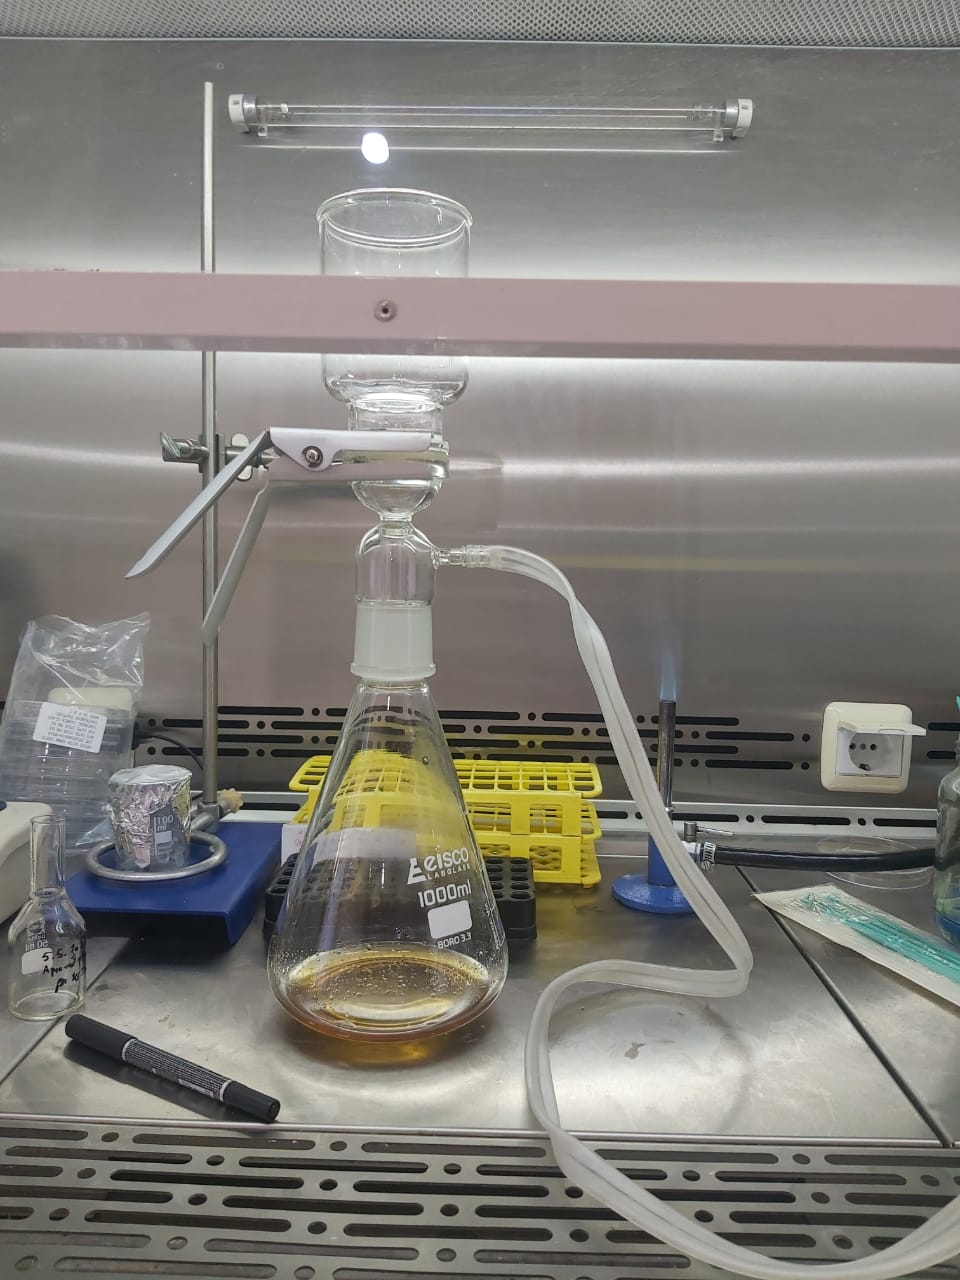
- After 10 days of medium incubation with shaking we proceed to Filtration using a filter whose pores have a diameter of 0.2 µm. The microorganisms are too large and are therefore retained by the filter.
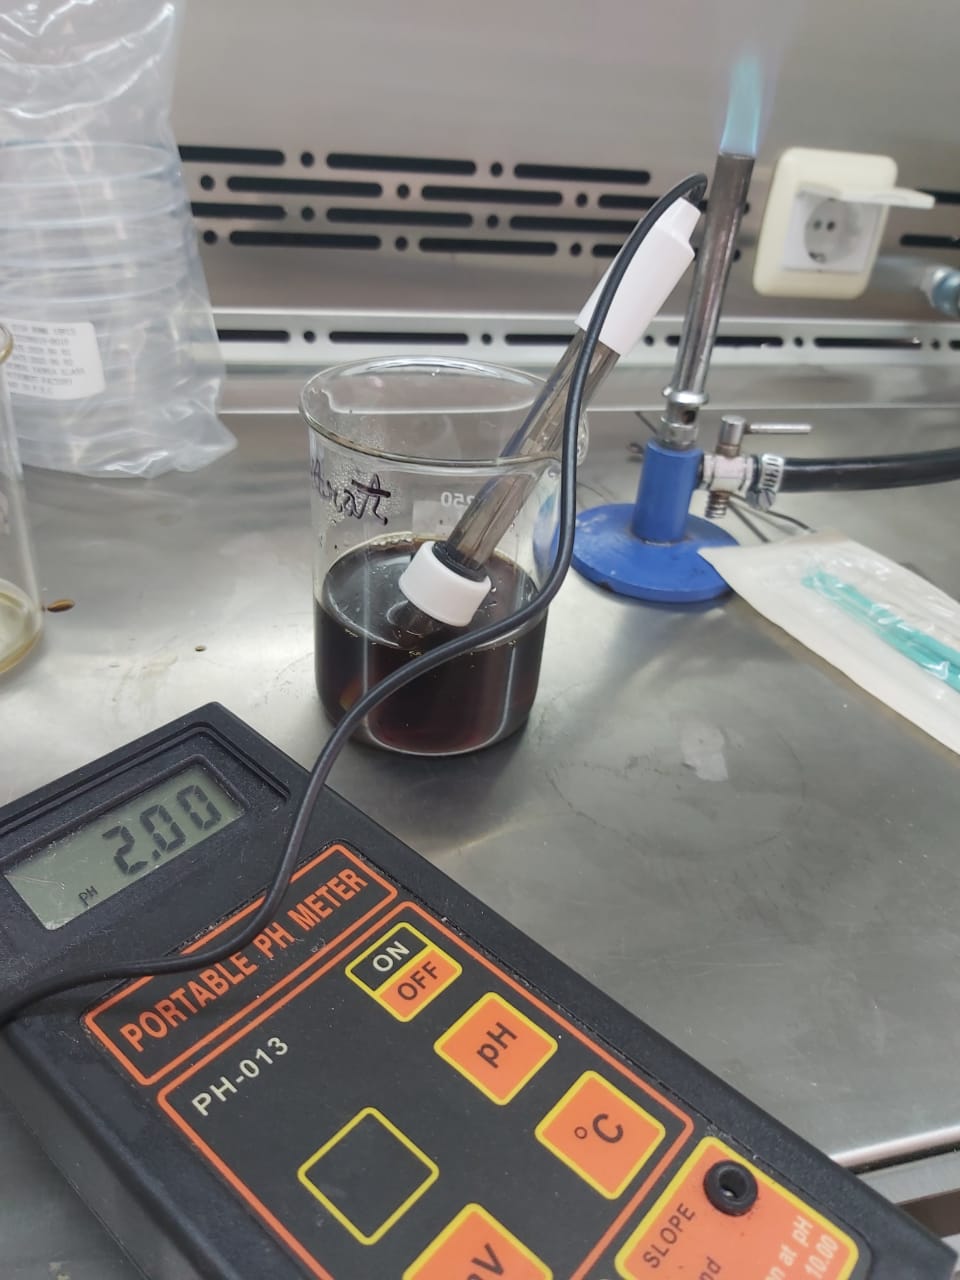
- After filtration, the pH of the filtrate is adjusted to 1.5-2.2 by adding H2SO4 (penicillin ionized in the solution) in order to stop any reaction that could degrade penicillin.
- The filtrate was then kept cold (5-10˚C).
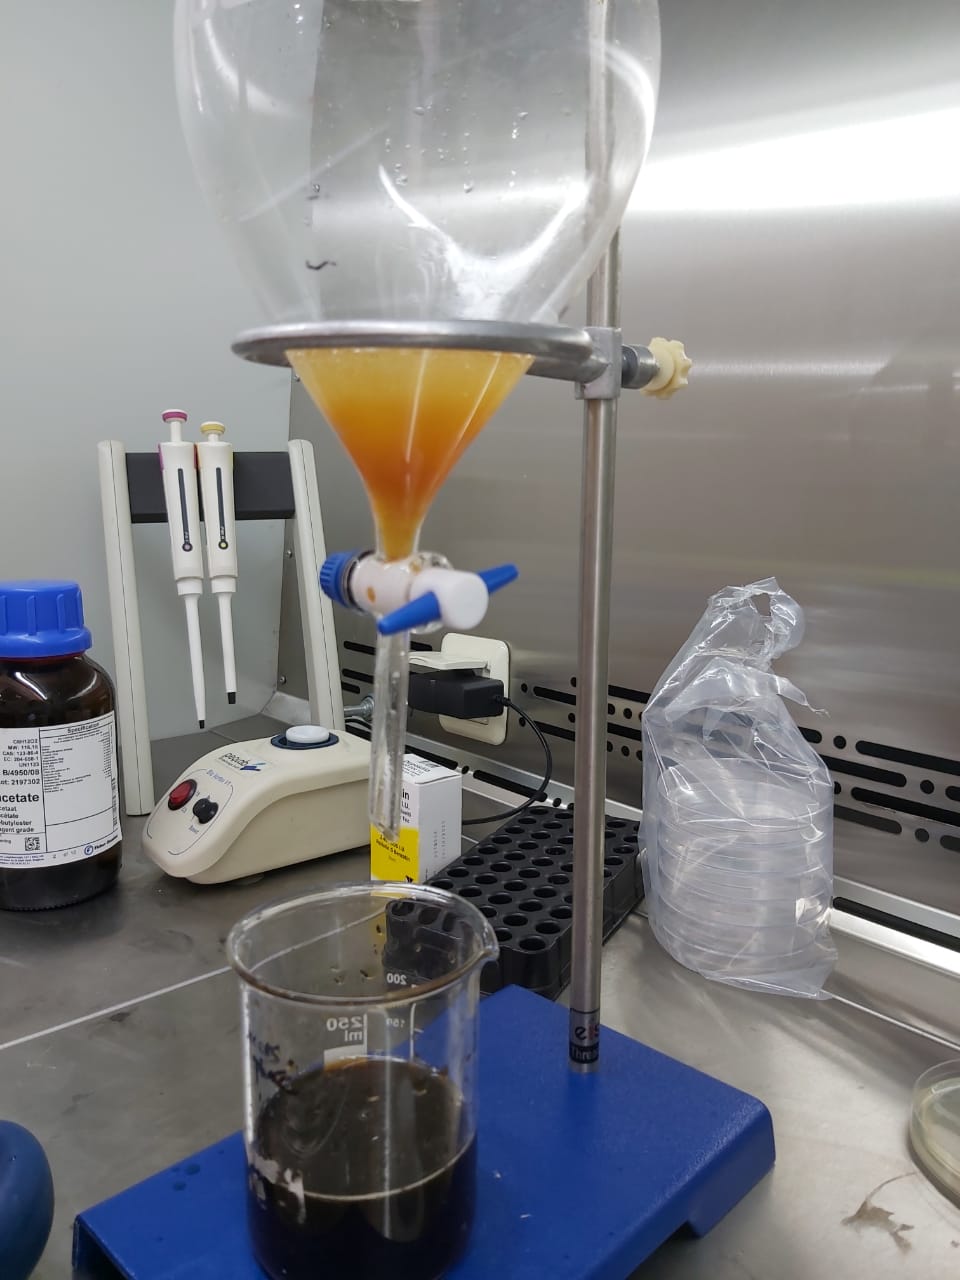
- Add the butyl acetate (1V solvent/2V filtrate) which serves as solvent for separating the organic phase and the aqueous phase(F1) using a separating funnel.
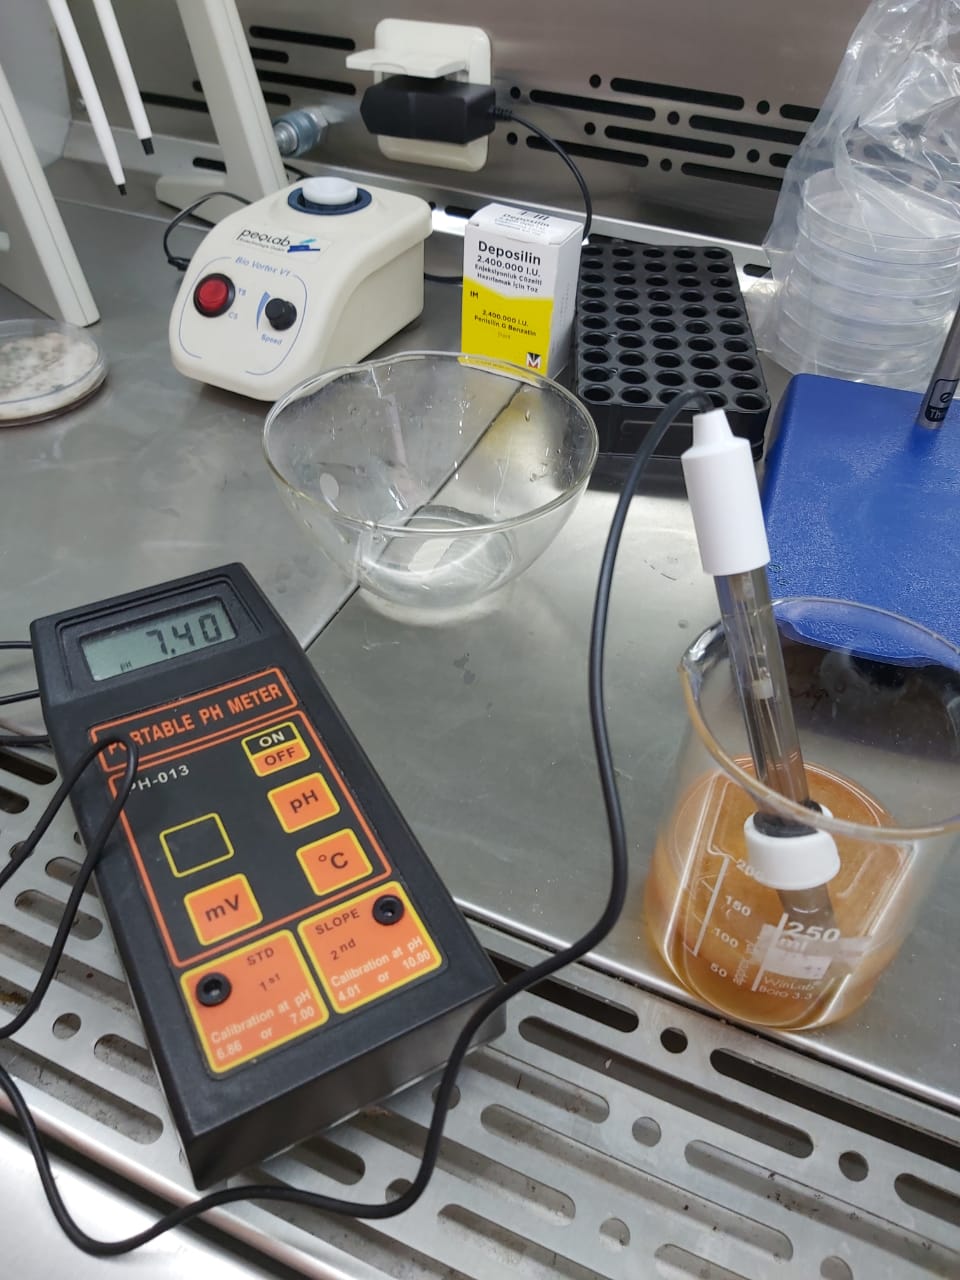
- Add 2% (W/V) phosphate buffer(PB) to the organic phase(F2).
- Adjust the PH to 7.5 by adding NaOH.
- Add 2% (W/V) NaHCO3 in order to carry out the crystallization.
- Cool the solution (F3) at 4˚C about 7 days .
- Filtrate and harvest penicillinG sodium salt.
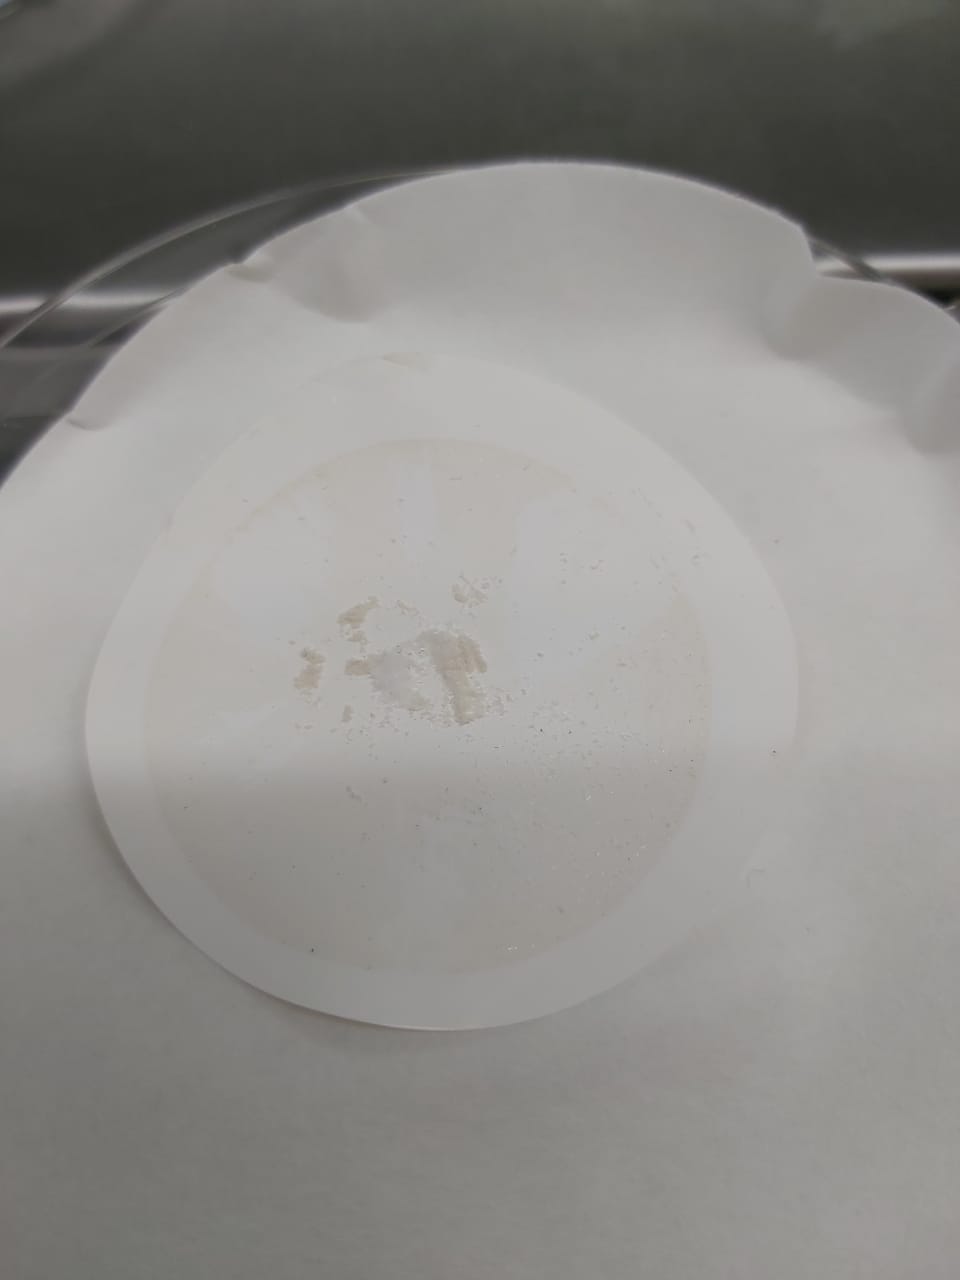
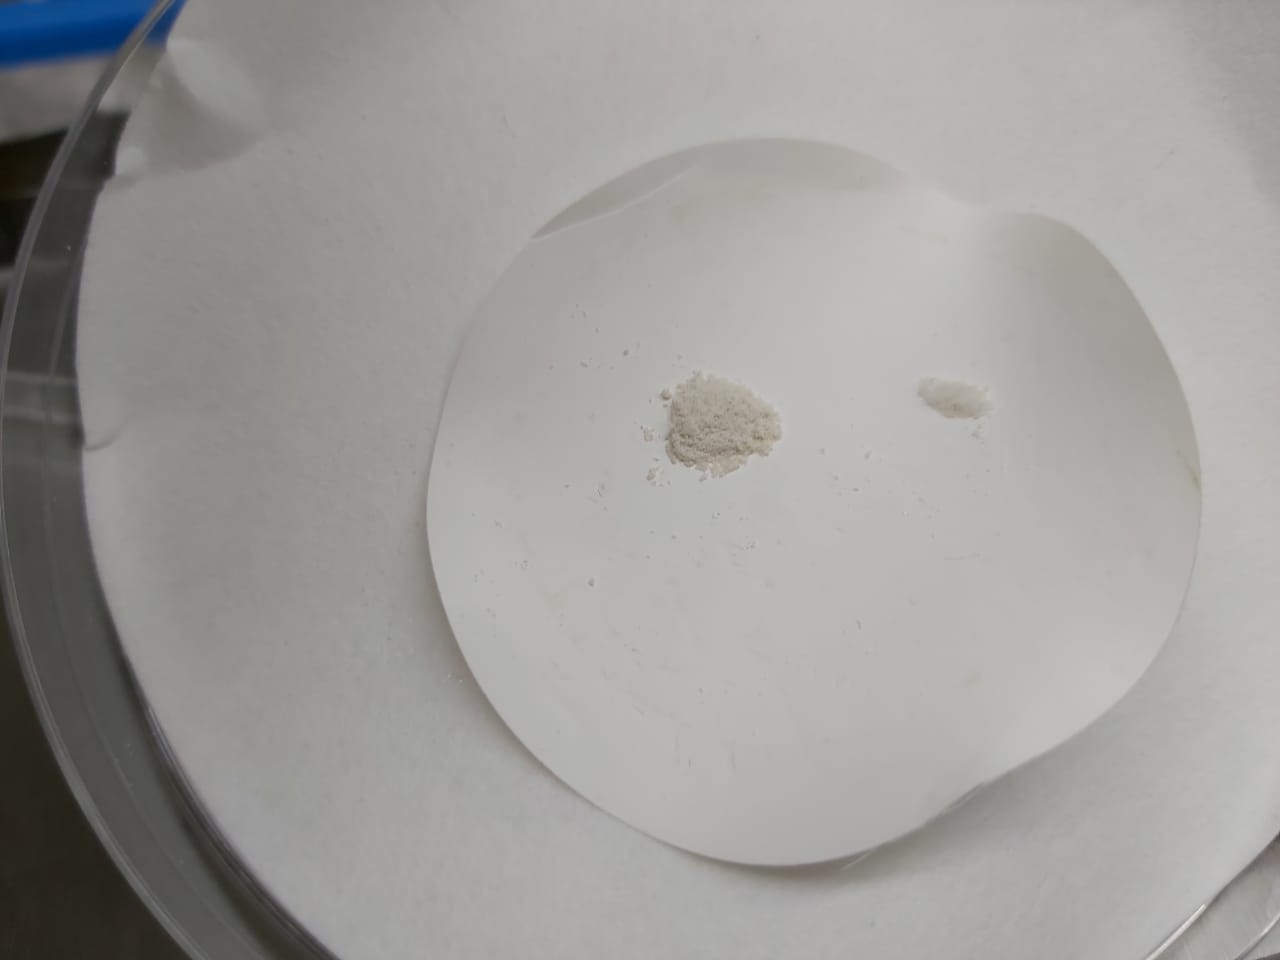
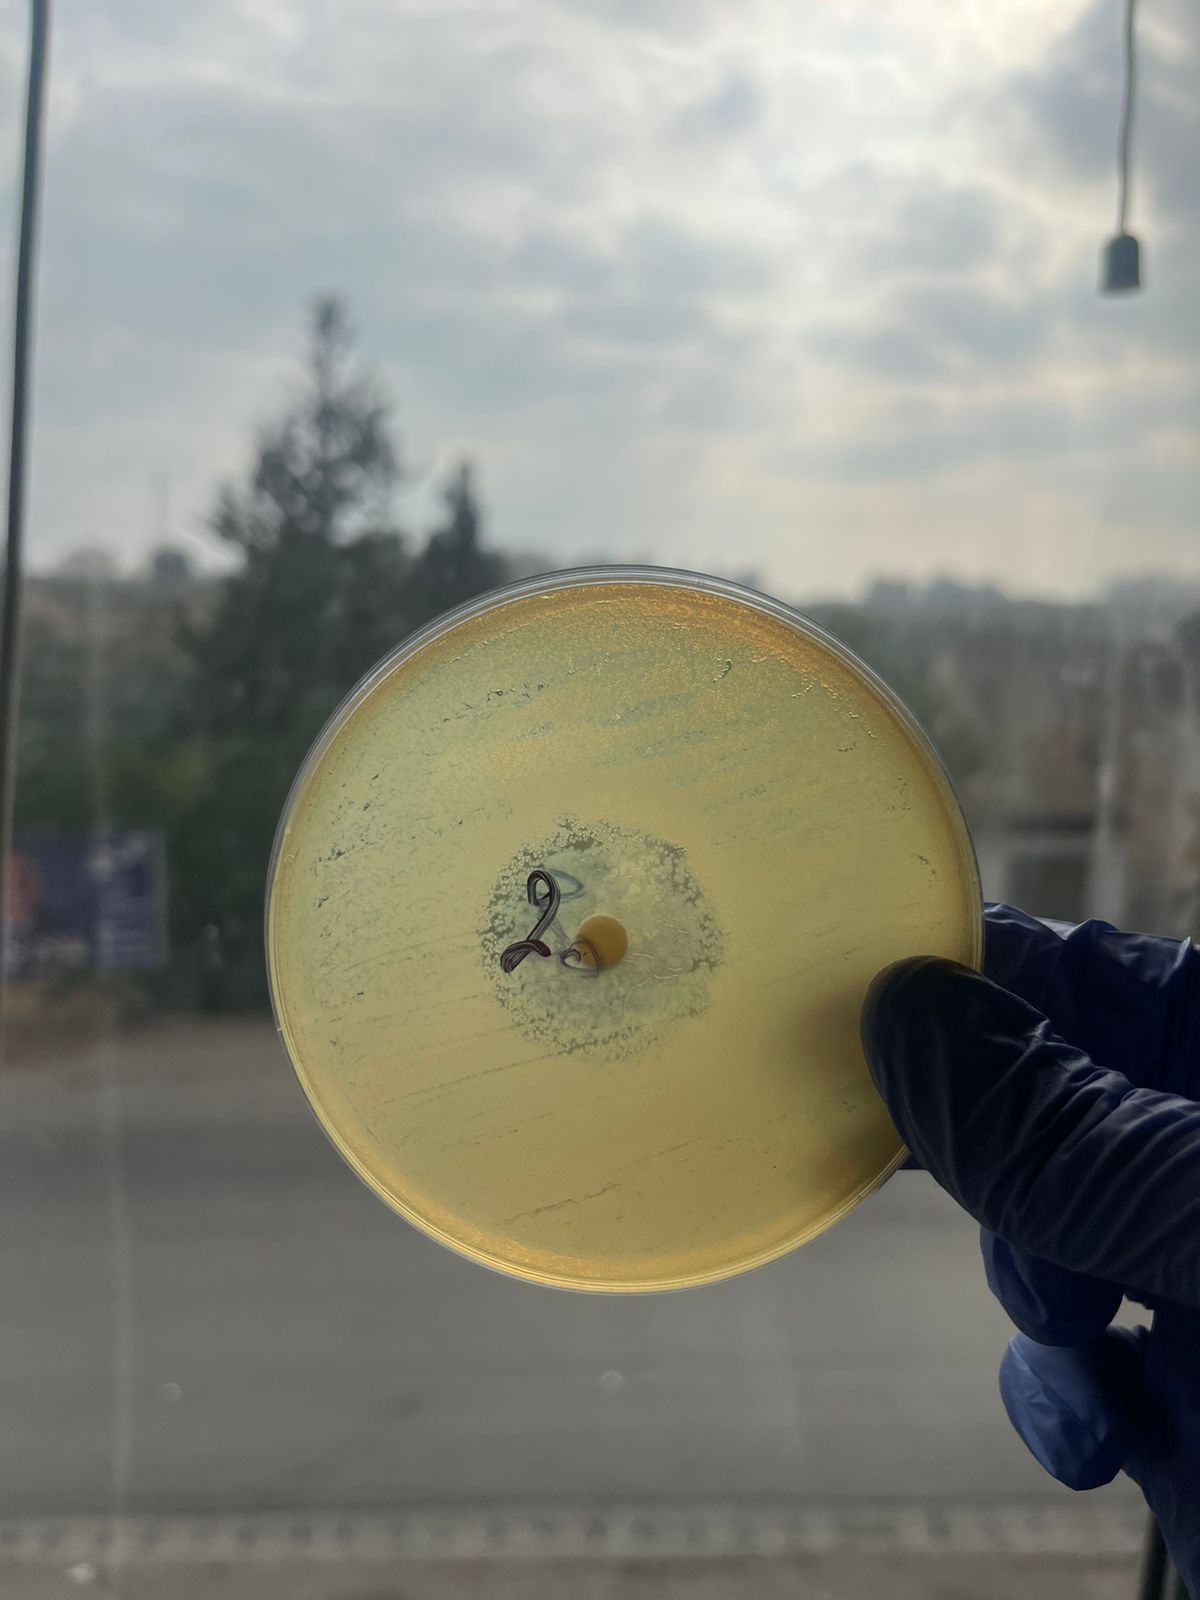
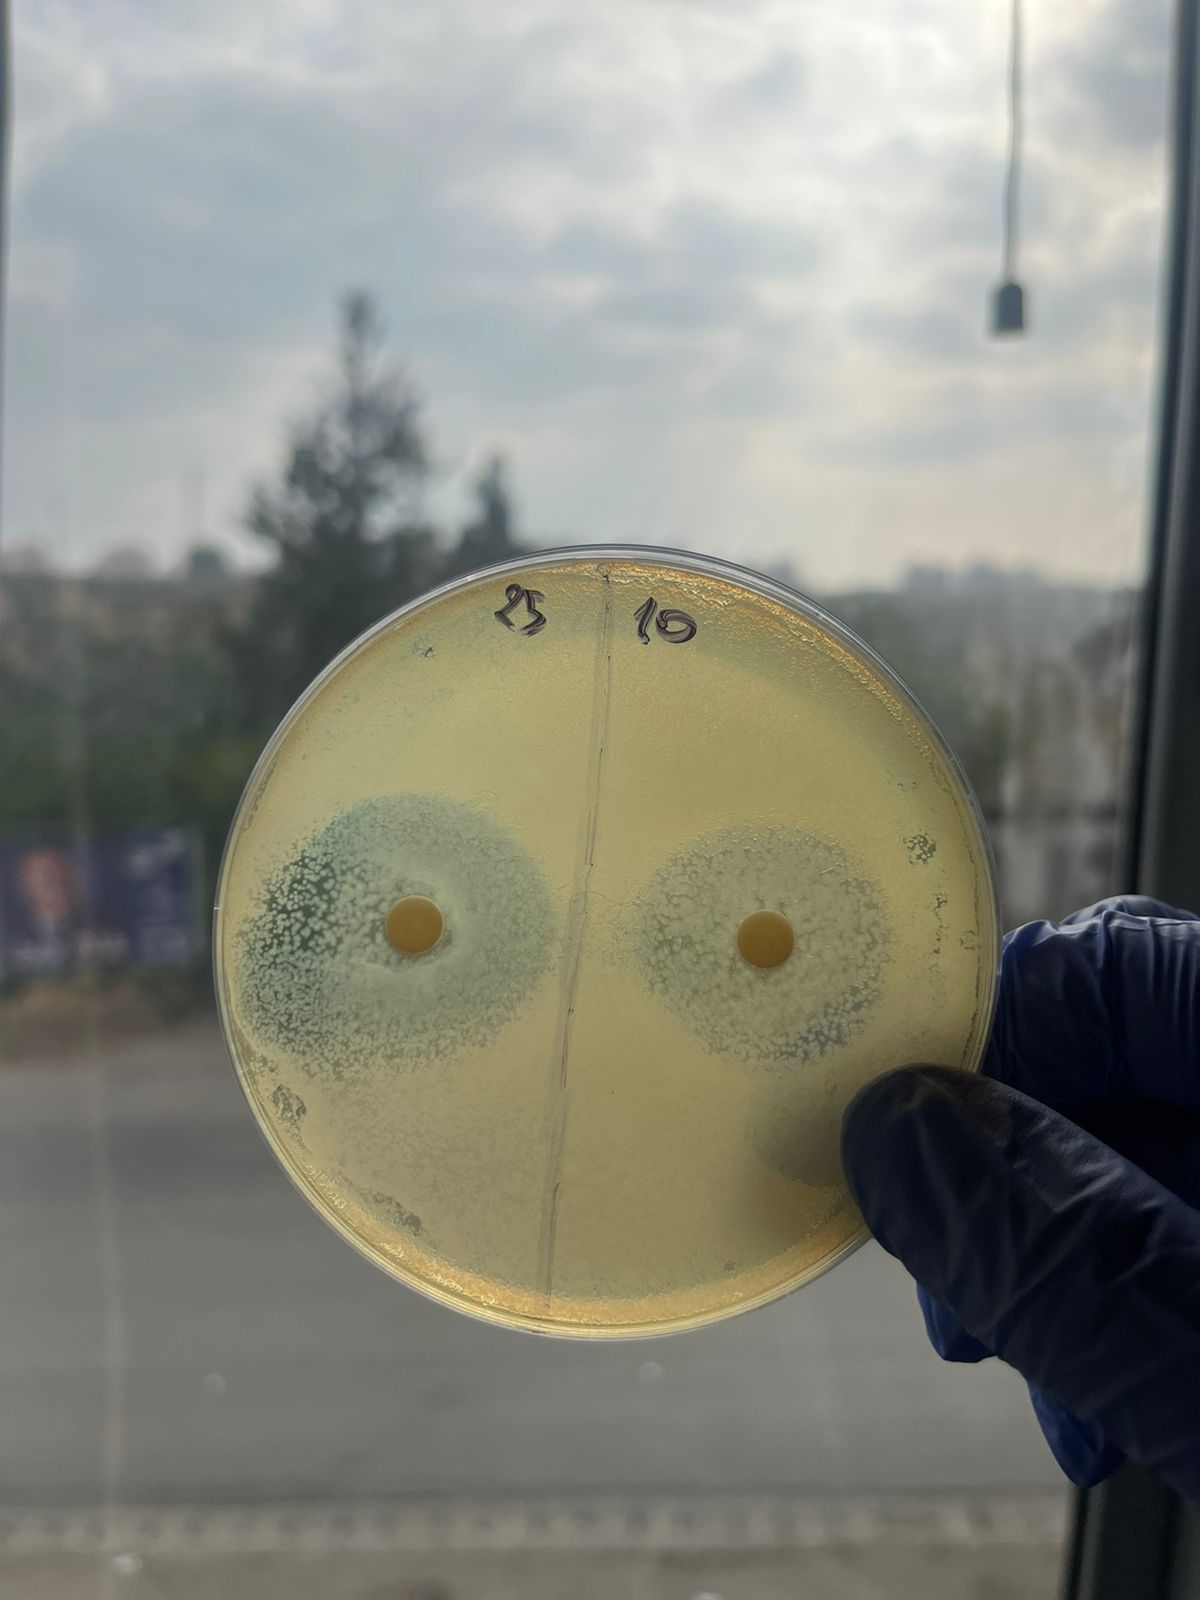
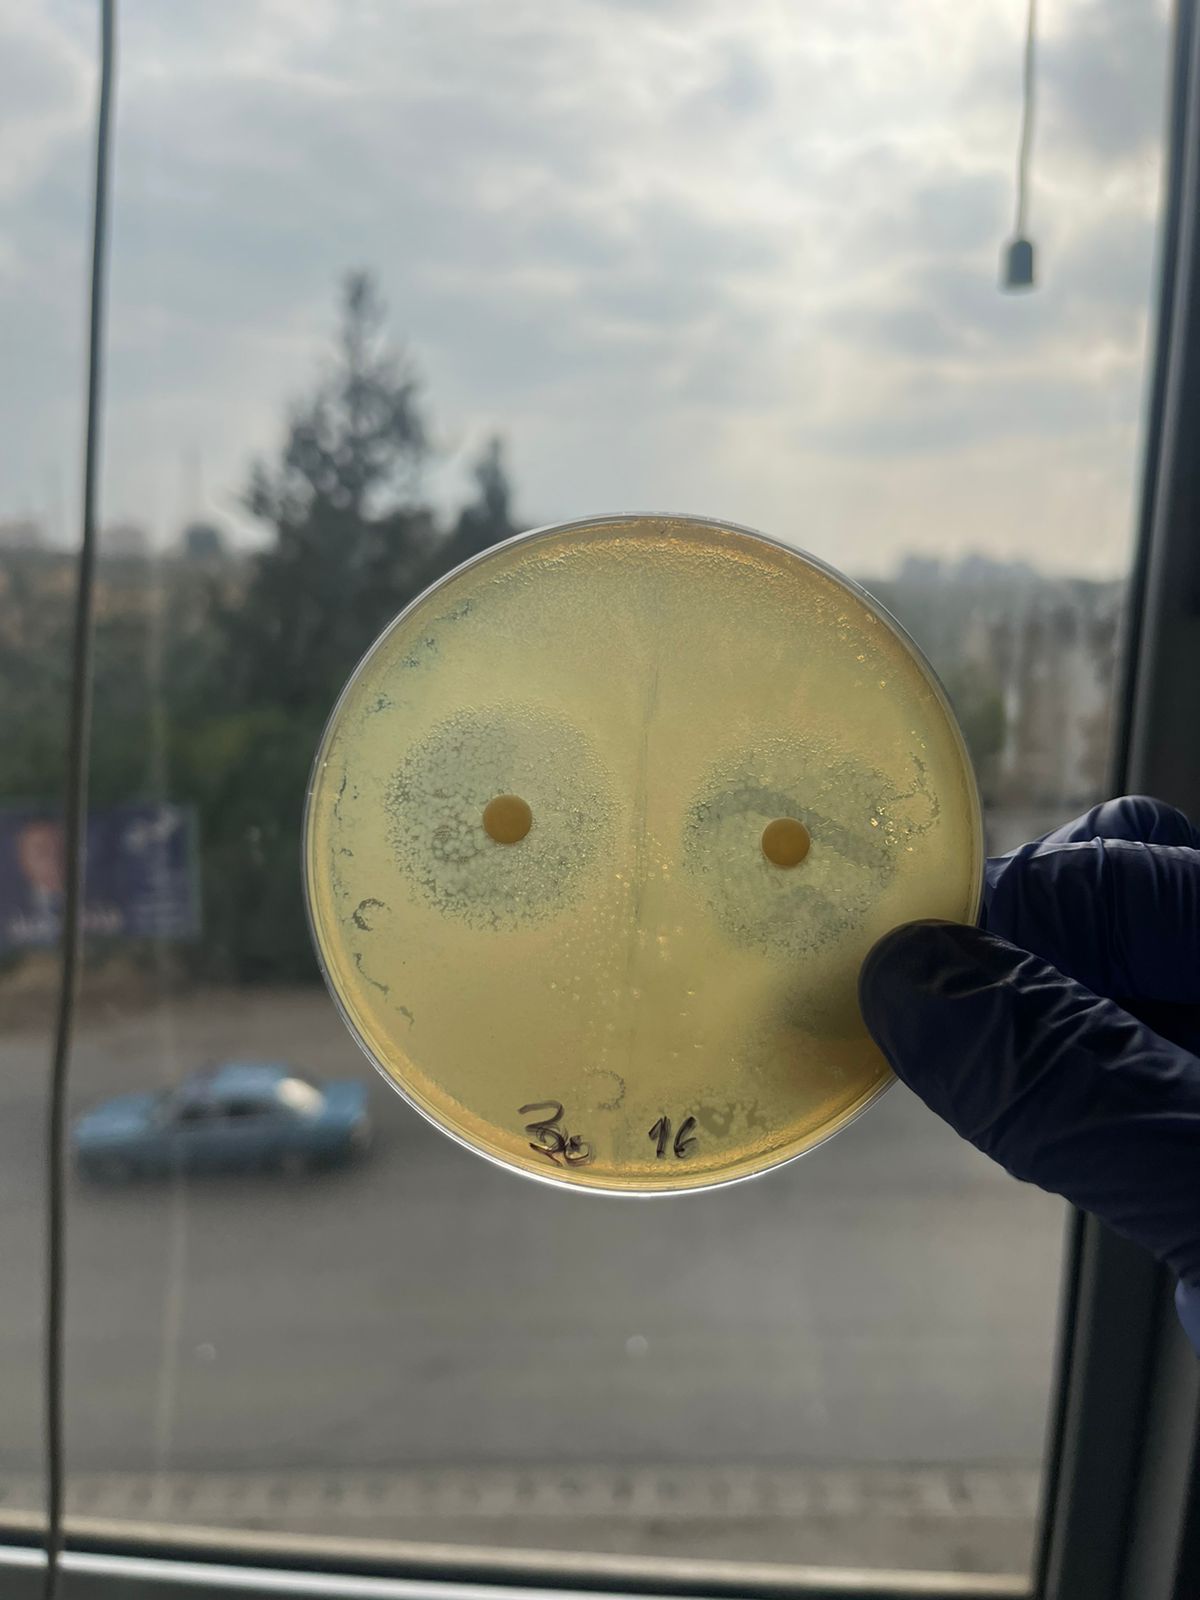
Results:
Trial 1:
We obtain clear white powder of crude PenG that will be used later for quantification so the crystallization has succeeded .
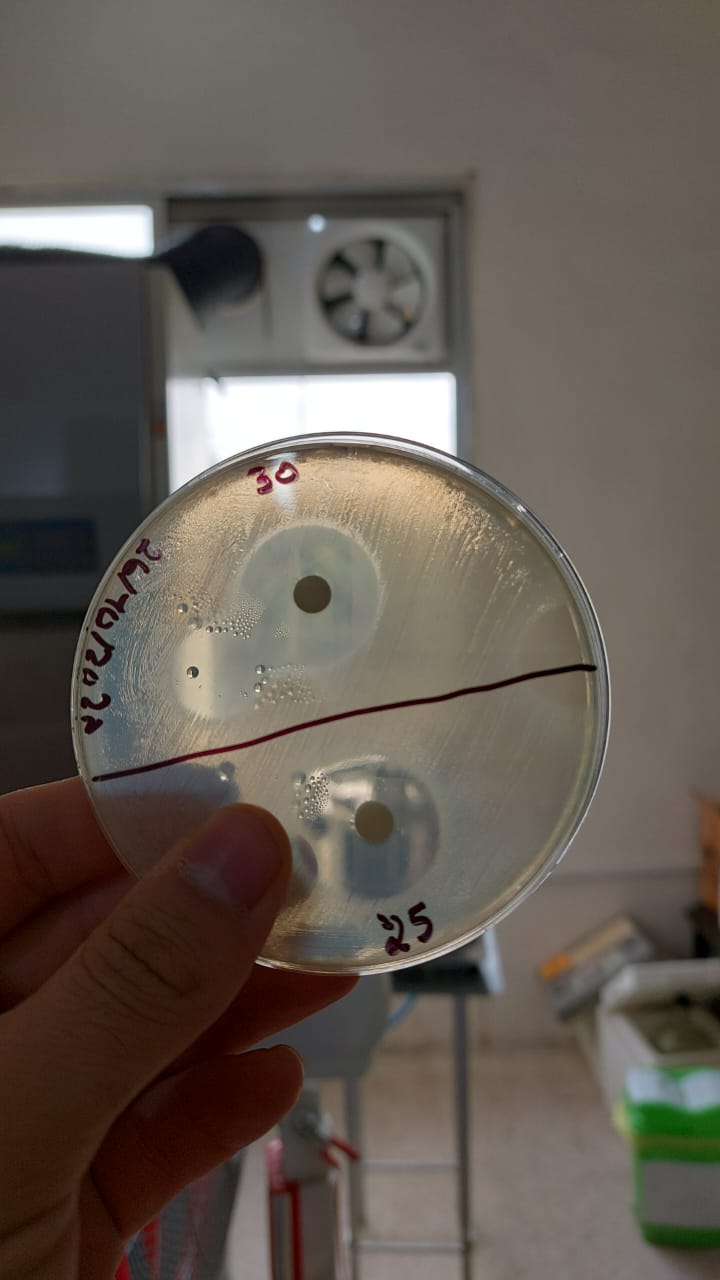
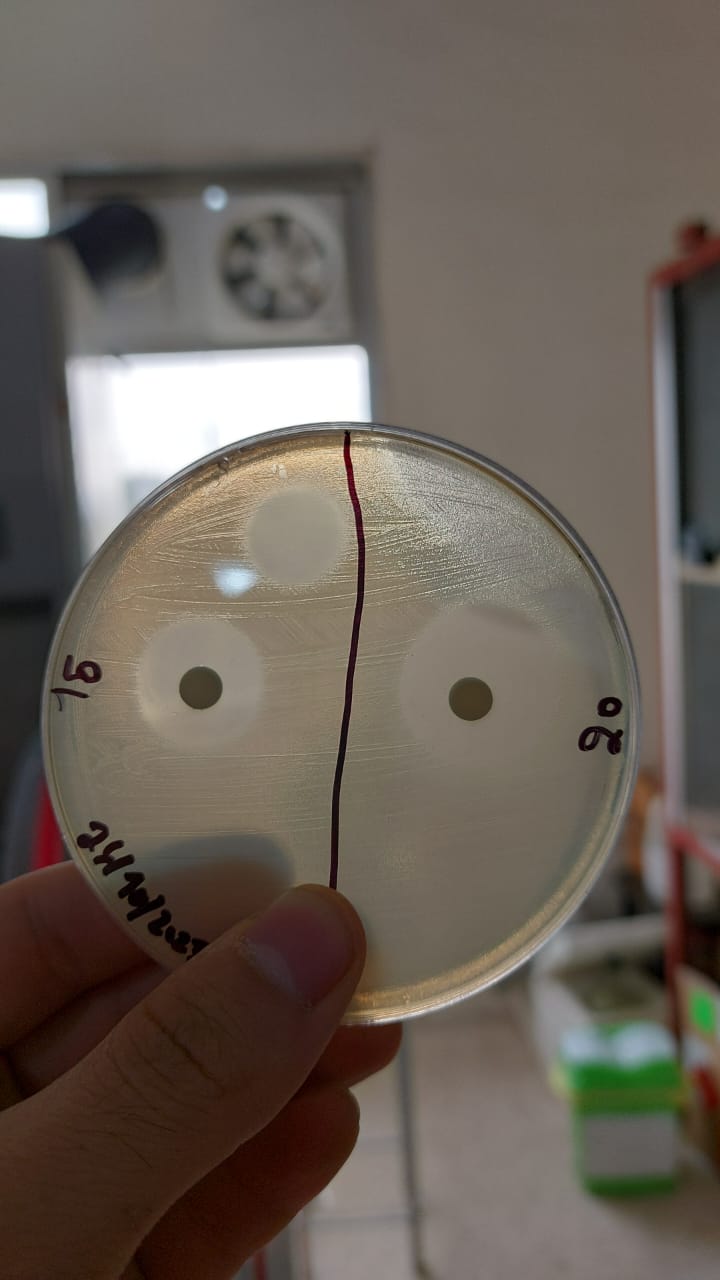
Note that we realize a sensitivity test for:
_F1(Aqueous phase after the organic solvent extraction)
_F2(Organic phase After PB extraction)
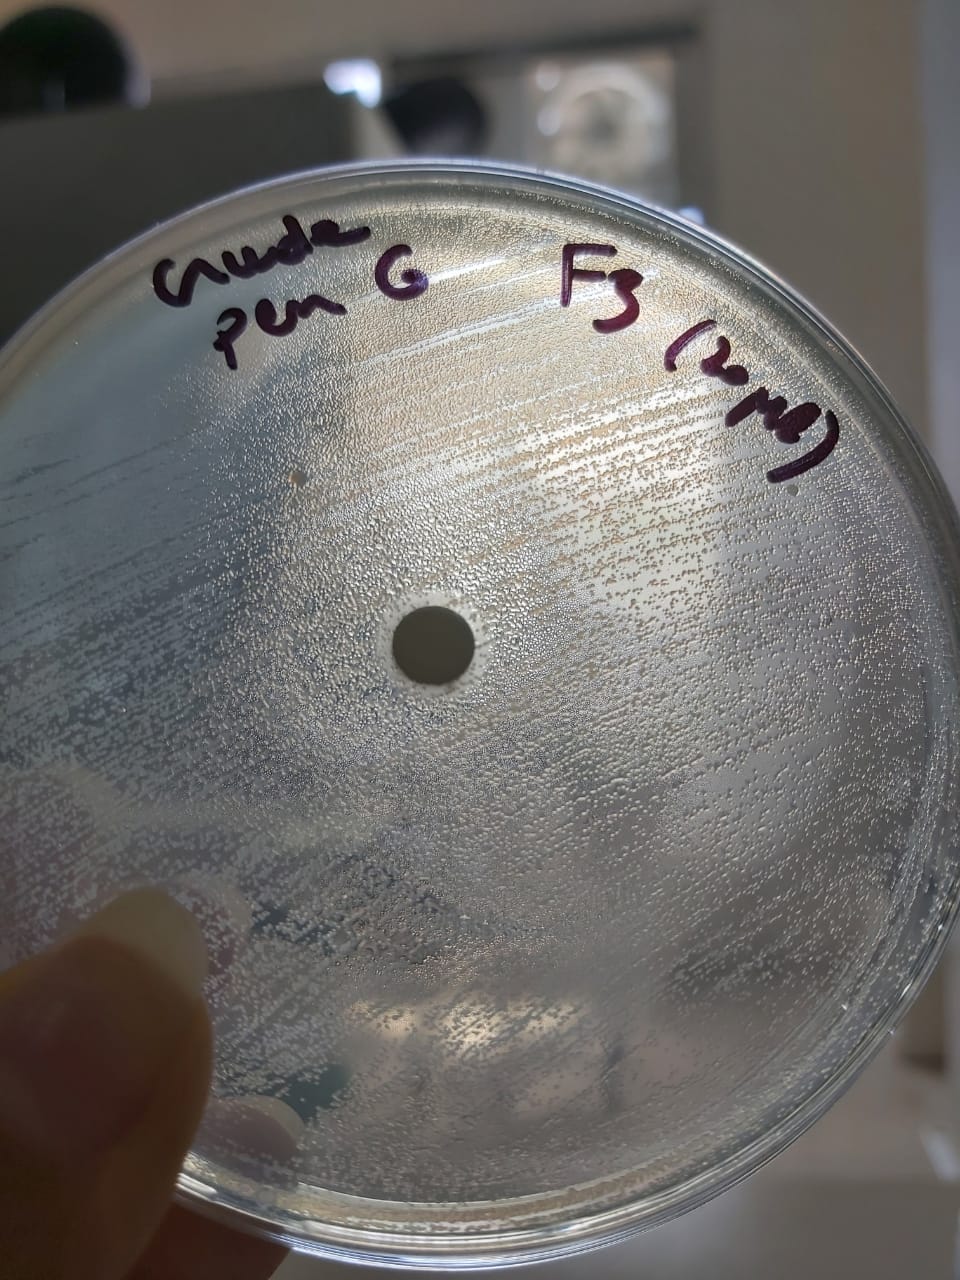
_F3(the final solution obtained after organic solvent extraction)
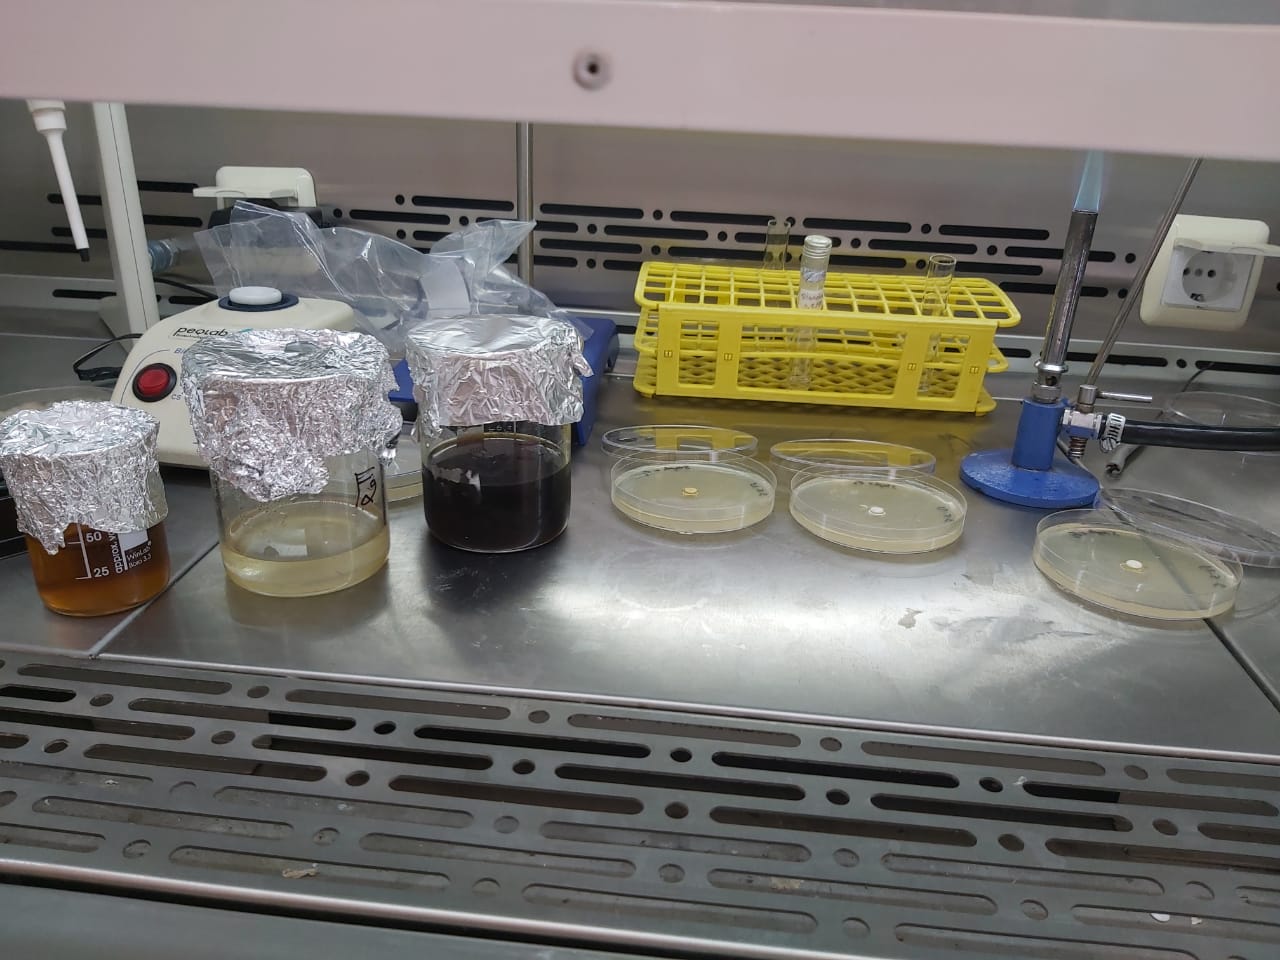
The results show :
A clear zone of inhibition in F1 which means that :
- There is PenG In F1 so we can say that the experiment has succeeded and the PAA produced in the lab is effective.
- Not all the PenG was extracted into the used organic solvent(there is a percentage of PenG loss).
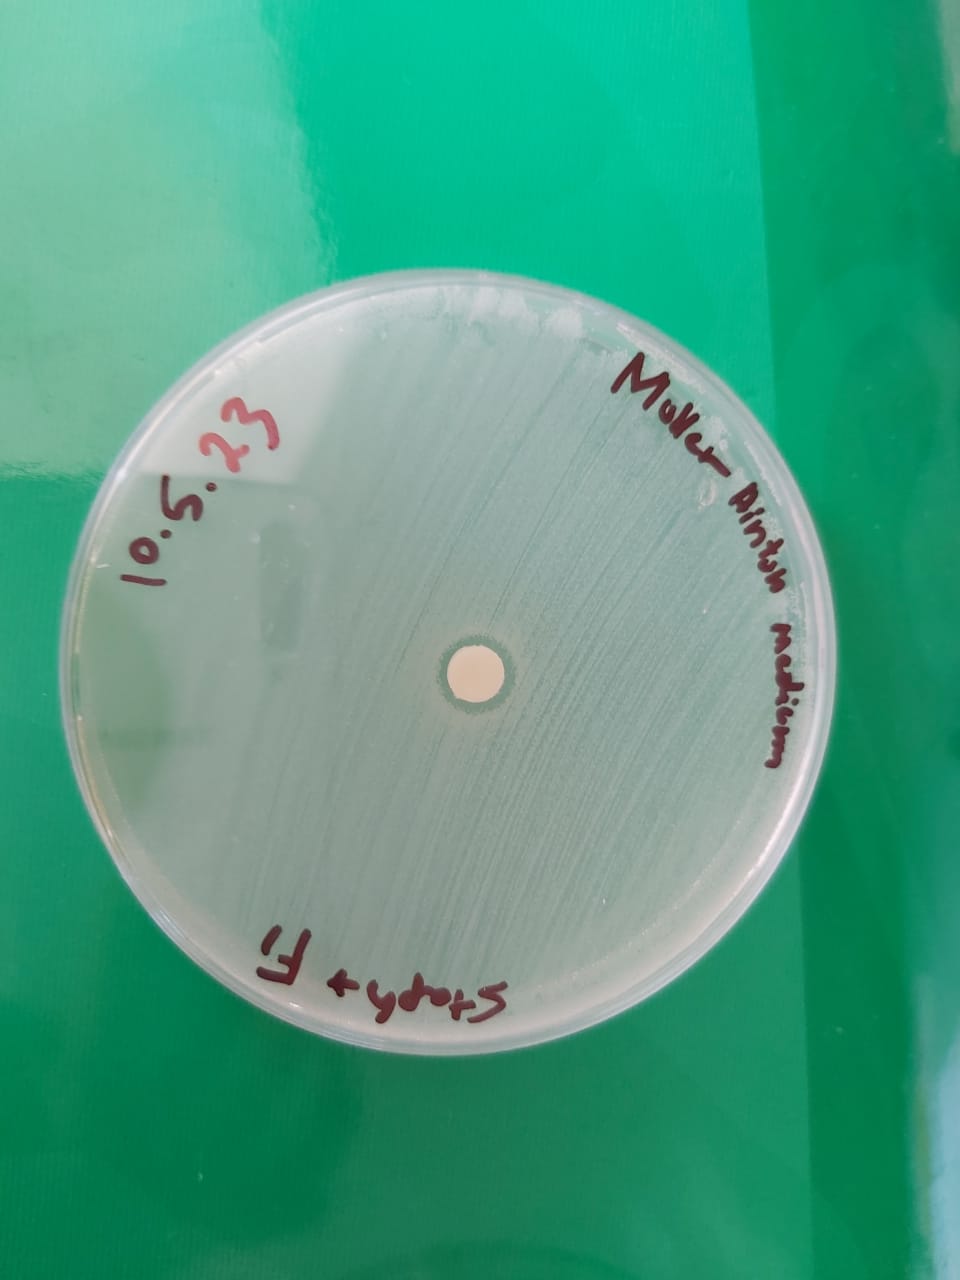
A clear zone of inhibition in F3 which means that :
- There is crude PenG in the final solution so the solvent used is effective.
- The purification has succeeded with a percentage of PenG loss in aqueous phaseF1.
No zone of inhibition in F2 which means that there is no loss of produced PenG in F2.
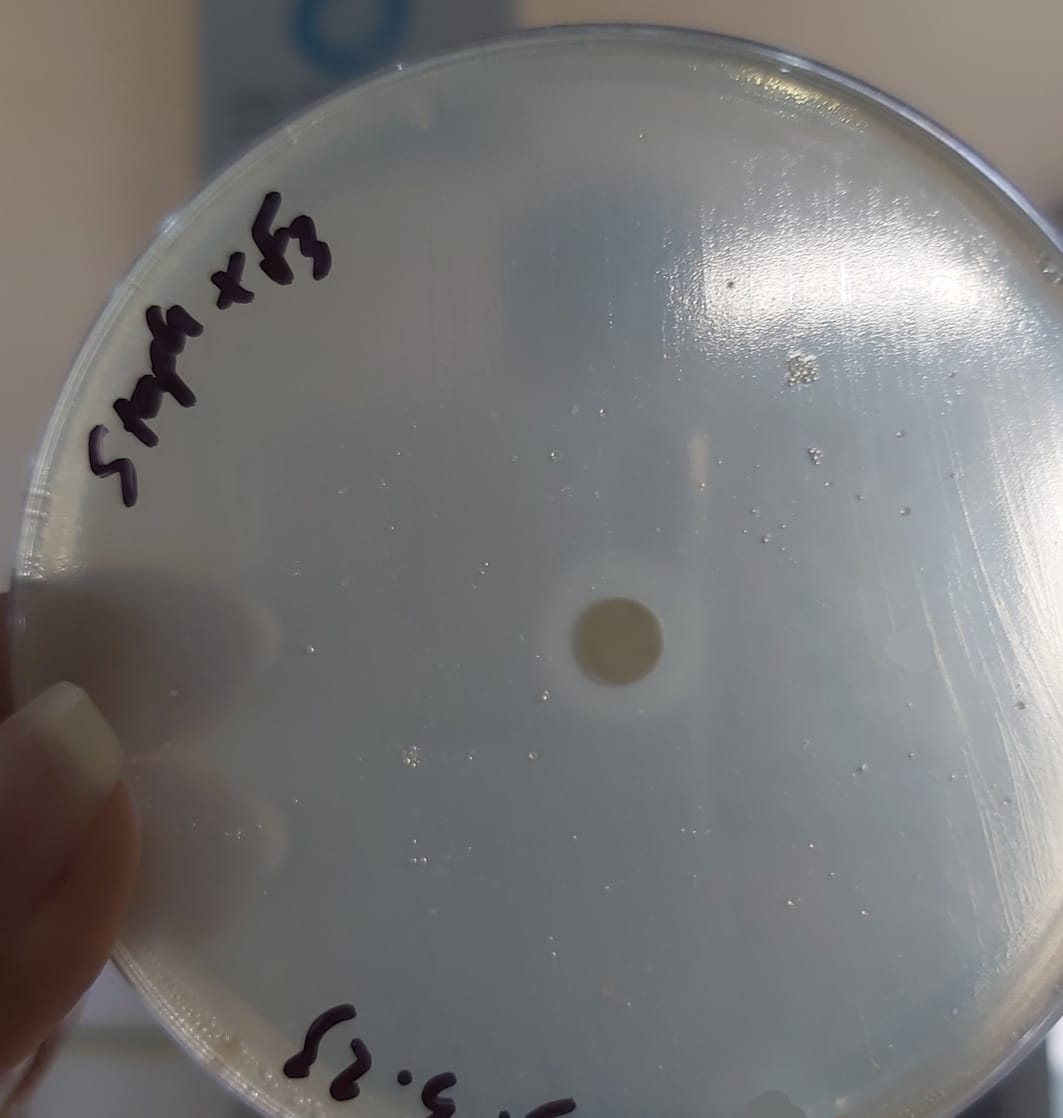
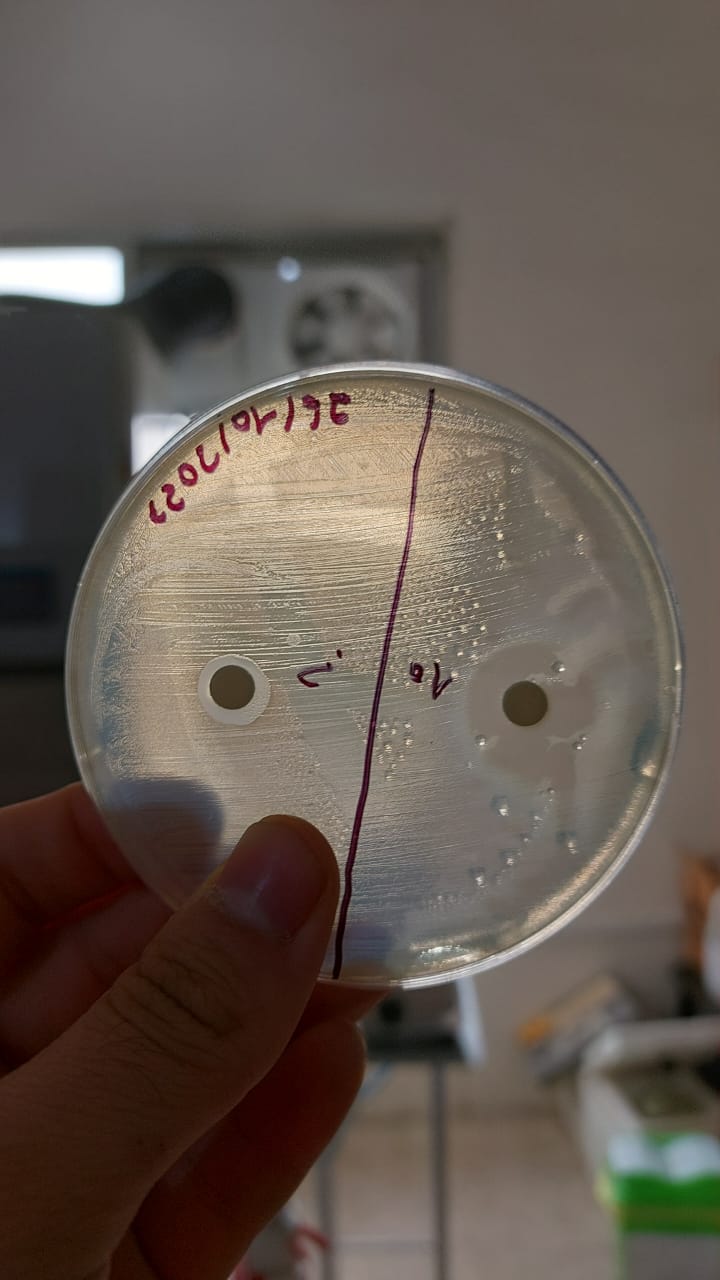
Trial 2:
according to the sensitivity test :
_F1(Aqueous phase after the organic solvent extraction)
_F2(Organic phase After PB extraction)
_F3(the final solution obtained after organic solvent extraction)
Penicillin Quantification (May 2023)
The procedure for quantification is the same as that mentioned before using disc diffusion method leading to a calibration curve helping to calculate the concentration of our crude PenG obtained from F1 and F3 solution:
Quantification of Crude PenG obtained from F1 crystallization:
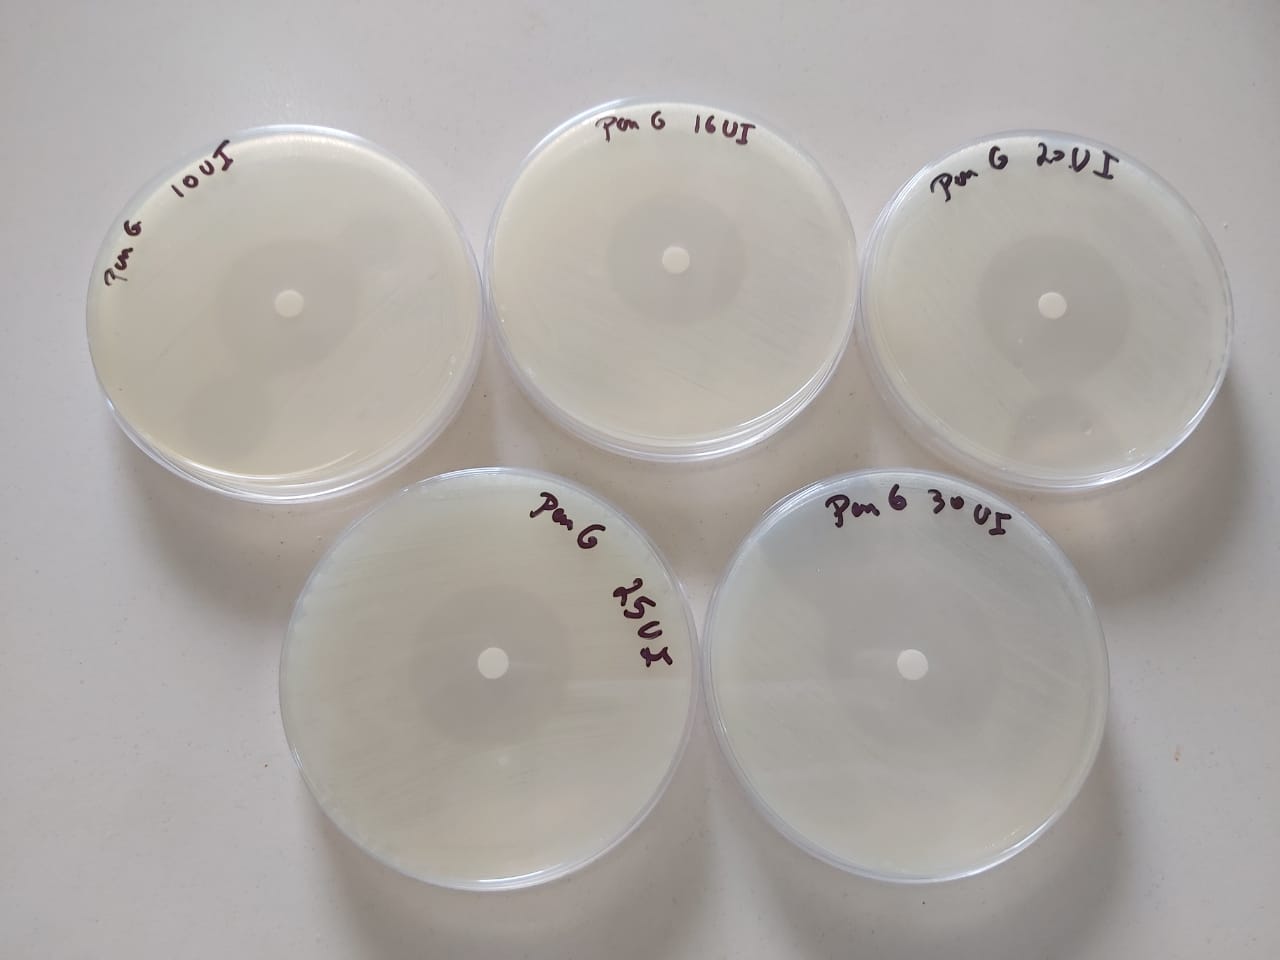
Table1 : Measurements of diameters of bacterial growth inhibition zones for different concentrations of standard dilute commercial penicillinG and F1.
|
Diameter(cm) |
2.8 |
3 |
3.3 |
3.4 |
3.6 |
3.8 |
4.9 |
5.7 |
6.2 |
0.9 |
|
LogC |
1 |
1.2 |
1.3 |
1.39 |
1.47 |
2 |
3 |
4 |
5 |
? |
|
Concentration(mg/ml) |
10 |
16 |
20 |
25 |
30 |
102 |
103 |
104 |
105 |
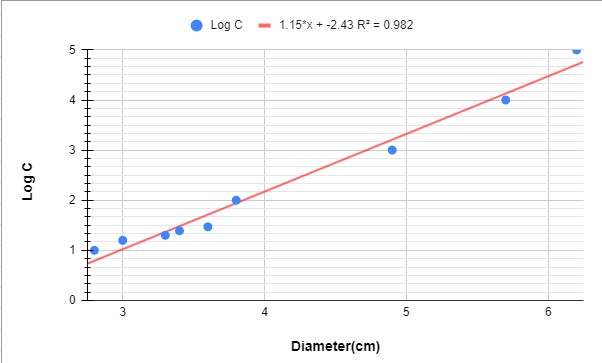
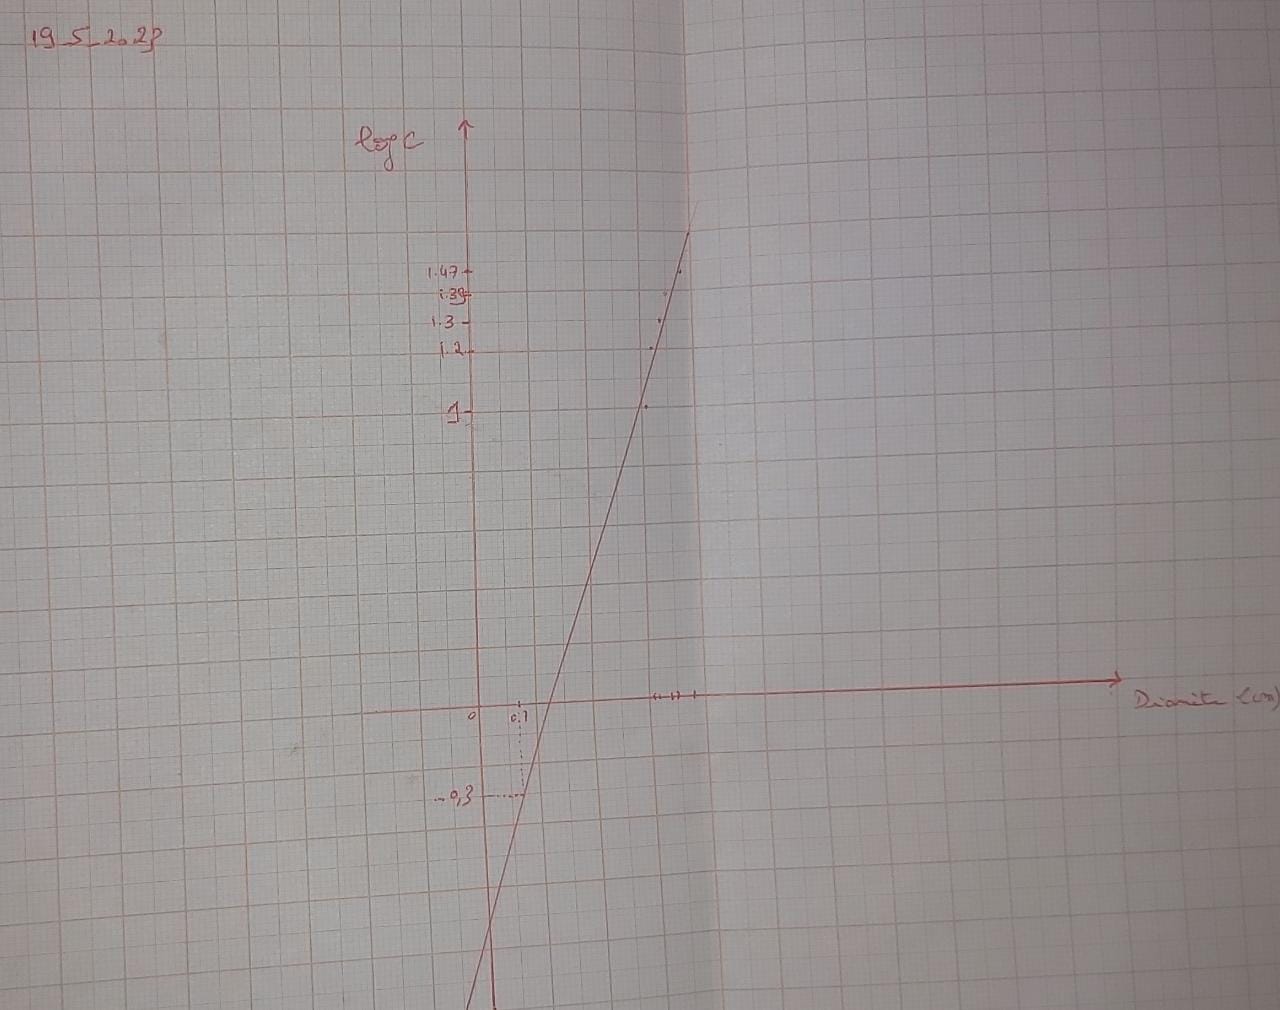
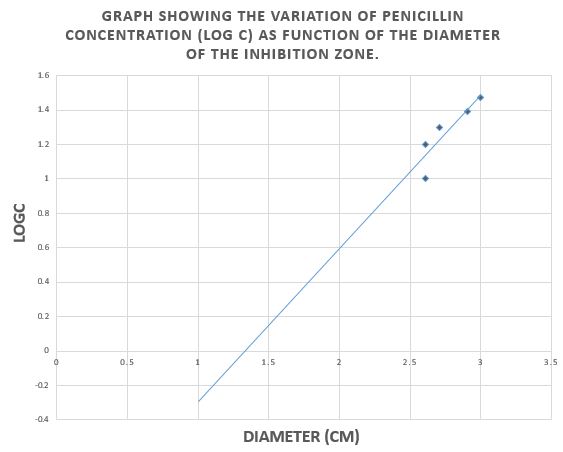
Graph 1: Graph showing the variation of penicillin concentration (LogC) as function of the diameter of the inhibition zone
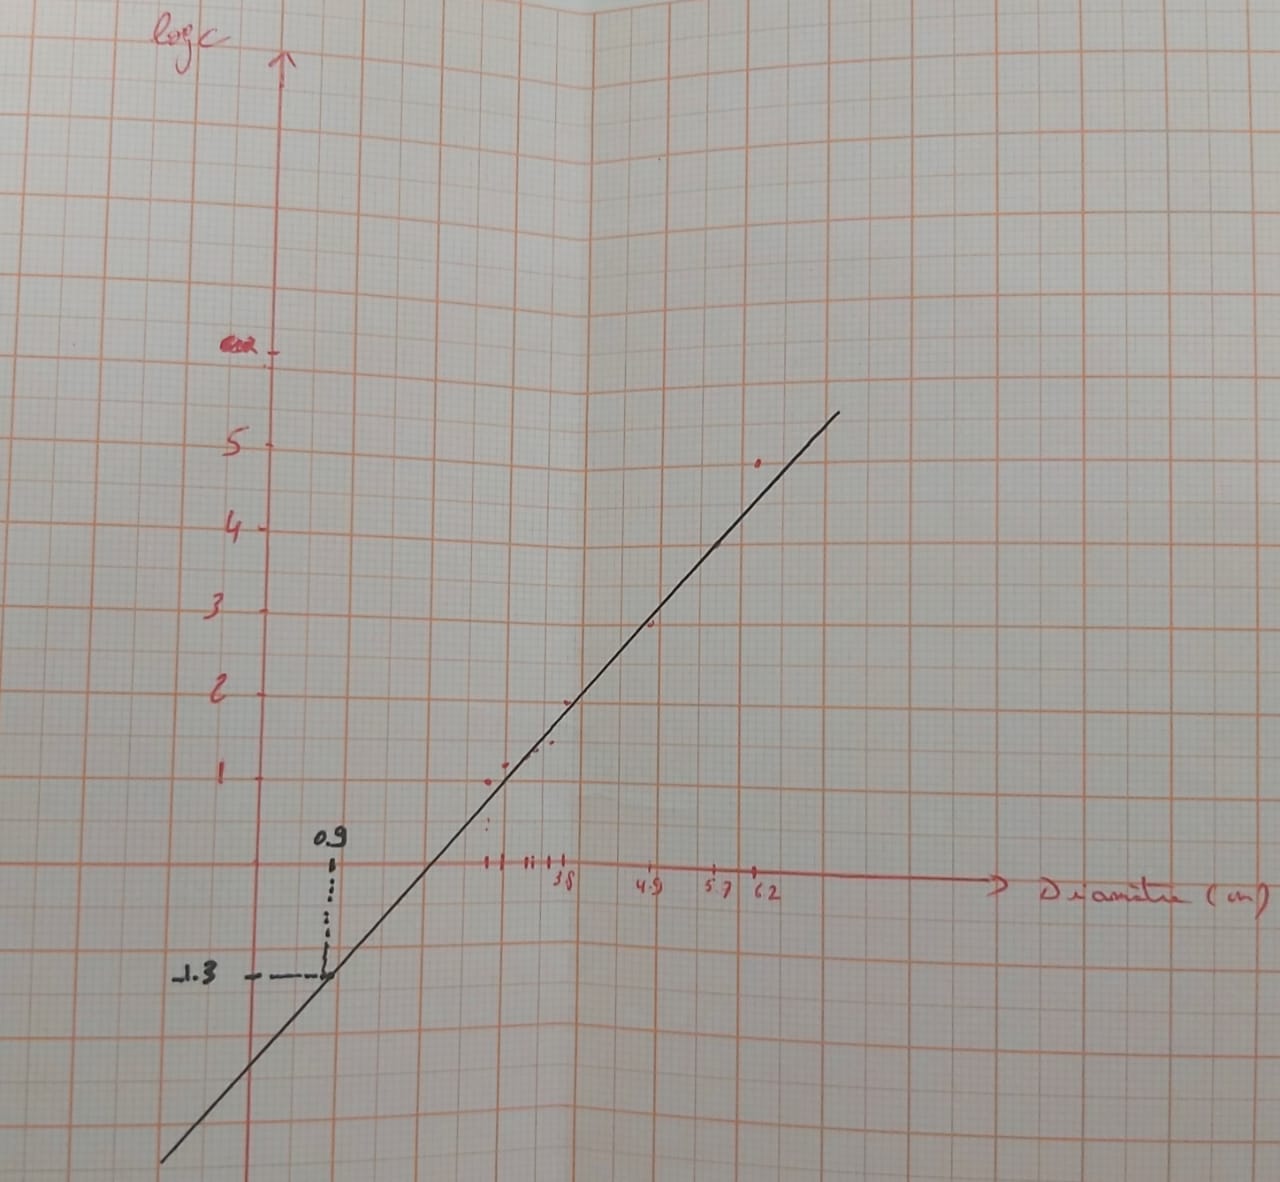
According to the calibration curve y=1.15x+(-2.43)
So the concentration of PenG in F1 is 0.04mg/ml
Quantification for Crude PenG obtained from F3 crystallization
Table 2 : Measurements of diameters of bacterial growth inhibition zones for different concentrations of standard dilute commercial penicillinG and F3 solution.
|
Diameter(cm) |
3.8 |
3.5 |
3.4 |
3.2 |
3.1 |
0.7 |
|
LogC |
1.47 |
1.39 |
1.30 |
1.20 |
1 |
? |
|
Concentration(mg/ml) |
30 |
25 |
20 |
16 |
10 |
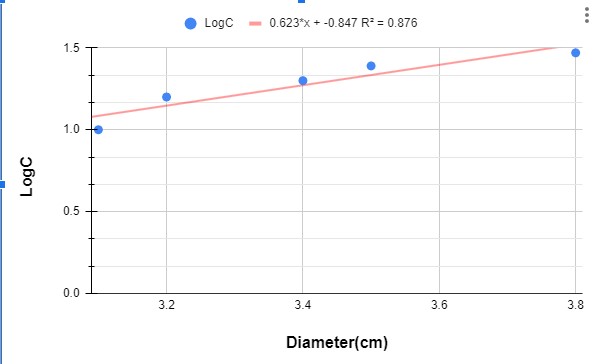
Graph 2 : Graph showing the variation of penicillin concentration (LogC) as function of the diameter of the inhibition zone.
According to the calibration curve y=0.623x+(-0.847)
So the concentration of PenG in F3 is 0.388mg/ml ~ 0.4 mg/ml.
Table showing every step with its duration and working date
|
Steps of preparation |
Working Date |
Duration(Days) |
|
Penicillium culture |
April 19 |
4 days |
|
Fermentation |
April24 to May3 |
10 days |
|
Purification: filtration |
May4 to May5 |
2 days |
|
Crystallization |
May5 to May12 |
7 days |
|
Sensitivity test |
May15 to May16 |
2 days |
|
Quantification/results F1 |
May15 to May16 |
2 days |
|
Sensitivity test Quantification/result F3 |
May18 to May 19 |
2 days |
Trial 3:
Same protocol reused in this trial (except: adding PAA : Phenylacetic acid every 24h at 30˚C for the first 48h then decrease the temprature to 25˚C for the rest of the fermentation).
PS : due to disfunction of the incubator we couldn't maintain the temprature ( between 25-30˚C) and solubility of the PAA
RESULTS:
]
| Diameter (cm) | 2.6 | 2.6 | 2.7 | 2.9 | 3 | 1 |
| Log C | 1 | 1.2 | 1.3 | 1.39 | 1.47 | -0.3 |
| Concentration (mg/ml) | 10 | 16 | 20 | 25 | 30 | 0.5 |
Word-docx-Stage-report-ghinwayounes-2023
trial 4
Same protocol reused in this trial (except:aeorbie respiration and medium: without glucose , lactose 3g ).
results
|
Diameter (cm) |
2.4 |
2.2 |
2.1 |
1.9 |
1.75 |
1.1 |
|
Log c |
1.47 |
1.39 |
1.30 |
1.20 |
1 |
0.89 |
|
Concentration(mg/ml) |
30 |
25 |
20 |
16 |
10 |
7.76 |
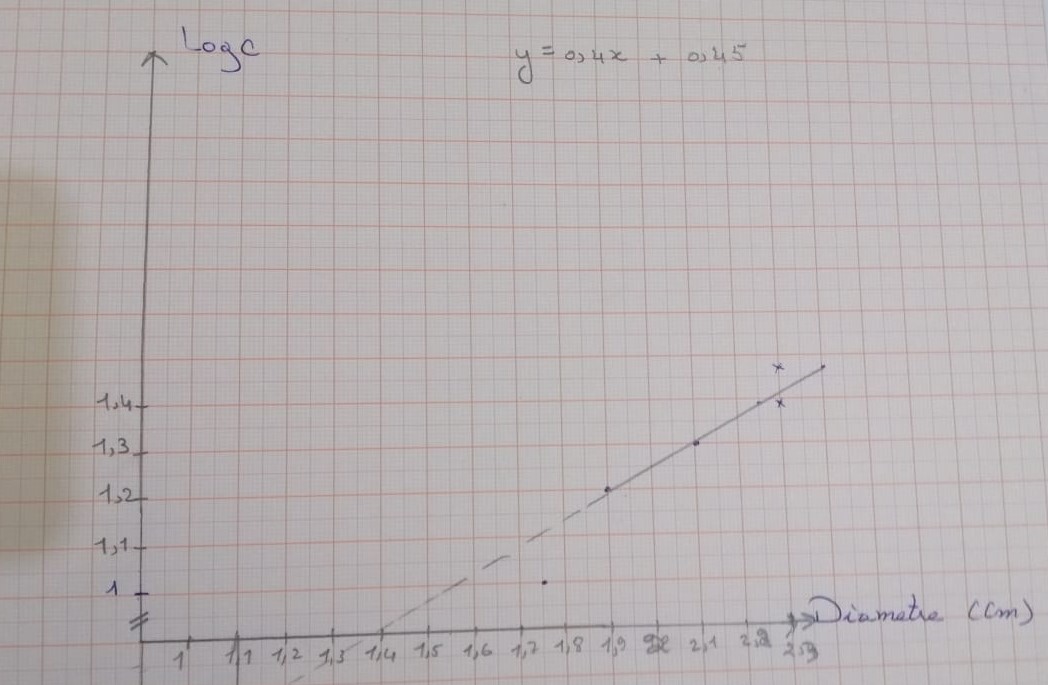
Graph showing the variation of penicillin concentration (LogC) as function of the diameter of the inhibition zone.